A 99% delivery rate feels like a win.
Your campaign goes out. Numbers look clean. Then the open rate report lands and it tells a completely different story. Flat. Sometimes worse than last time.
That gap is not random. It is not your subject line. And it is definitely not your list size.
It comes down to one thing: where your emails actually landed.
The delivery rate tells you an email reached a server. Inbox placement tells you whether a real person ever had a chance to see it. That difference is not a technicality. It is the reason campaigns succeed or quietly fail without anyone figuring out why.
If your open rate is underperforming and you cannot pinpoint the cause, this is where to start looking.
What Is Inbox Placement Rate?
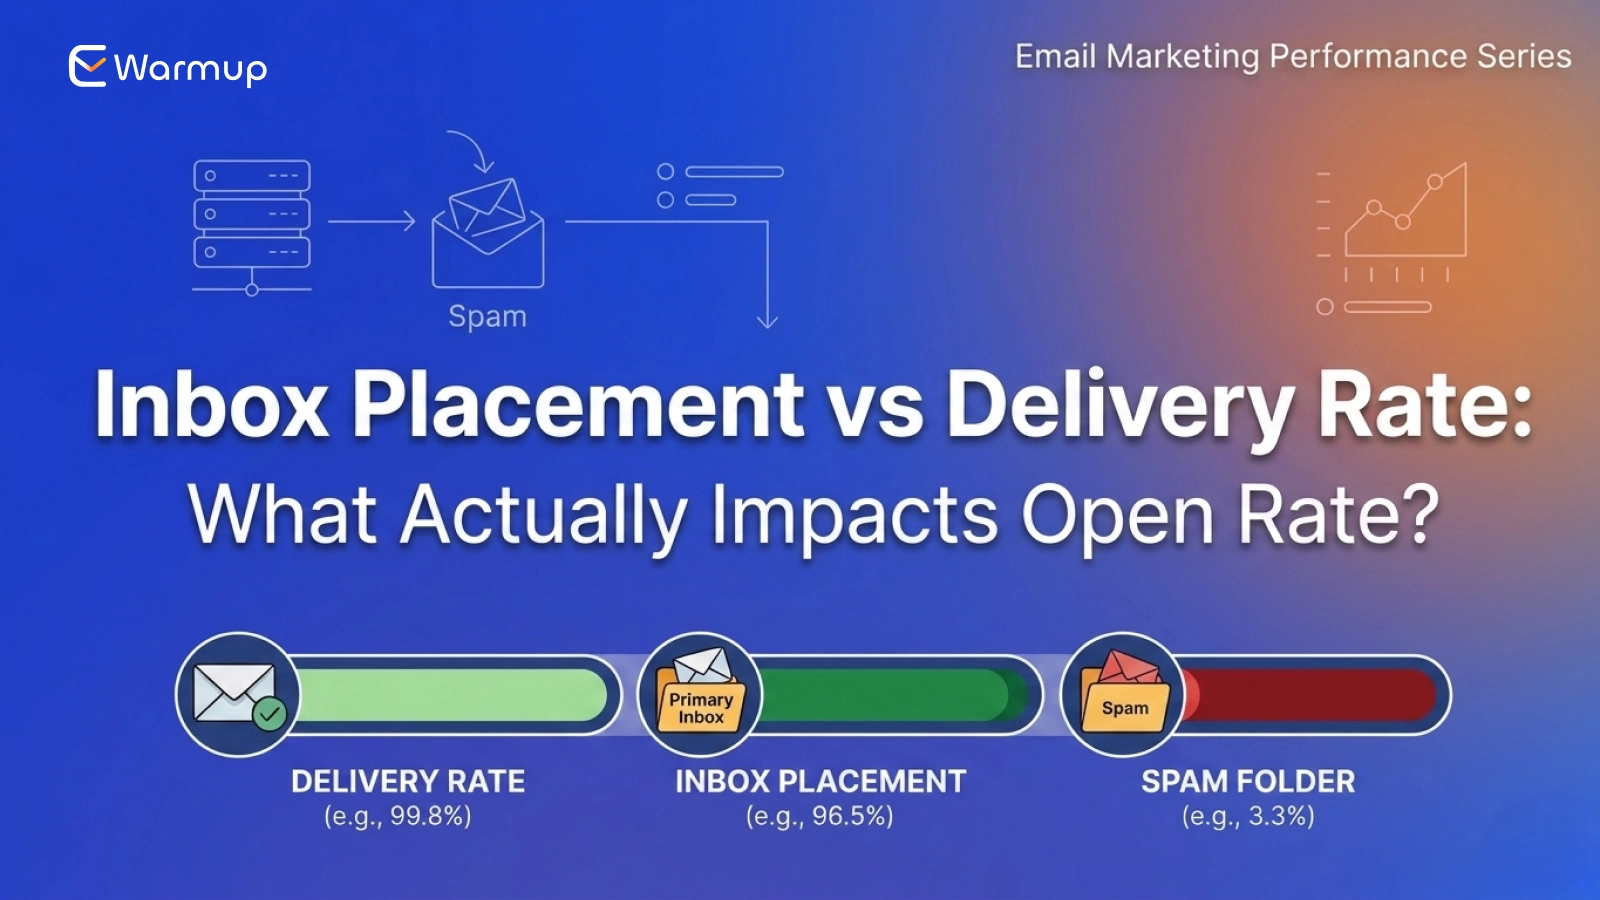
Inbox placement rate is the percentage of sent emails that land in the primary inbox. Not spam, not promotions, not buried in a tab nobody checks.
It answers a practical question: did your email show up where people actually look?
You measure it through seed testing. You send emails to controlled inboxes across providers like Gmail and Outlook, then track exactly where each one lands. If you have never run this test before, the results are often surprising. To understand how the process works in detail, read our guide on [Inbox Placement Test: The Ignored Metric That Decides Your Open Rate in 2026].
A healthy rate sits above 90%. Once you drop below 70%, the performance issues become hard to ignore. Open rates dip. Clicks follow. Revenue takes the hit, and most teams spend weeks blaming the wrong things.
Delivery Rate vs Inbox Placement: What Is the Actual Difference?
Delivery rate measures whether a receiving server accepted your email. Inbox placement measures whether it actually reached the inbox instead of spam.
Sounds like a small distinction. It is not.
Delivery rate is a catch-all. It counts emails that landed in the primary inbox, the promotions tab, the spam folder, all of it. If the server accepted it, it counts as delivered.
So when someone says they have a 99% delivery rate, a large chunk of those emails could be sitting in spam right now. Nobody opened them. Nobody ever will.
The placement metric removes that noise. It only counts what actually matters: emails sitting in front of real eyes.
Tracking delivery rate tells you your system is working. Tracking where emails actually land tells you your emails are working.
Why a 99% Delivery Rate Can Still Mean Poor Results
Here is a scenario most email marketers have lived through without realizing it.
You send 1,000 emails. 990 get delivered. That is a 99% delivery rate. Looks solid.
But 400 of those land in spam. Another 150 slides into promotions. Only 440 hit the primary inbox.
Your real reach is roughly 44%.
That is the number that drives opens, clicks, and replies. Not 99%.
This is where the damage happens quietly. Teams run A/B tests on subject lines, try different send times, rewrite copy, while the actual problem sits much earlier in the pipeline. If the email never reaches someone’s primary inbox, none of the other optimizations matter.
This is a deliverability problem, not a content problem. Fixing it requires looking at infrastructure, sender reputation, and domain warmup, not copy. According to research from Validity’s 2025 Email Deliverability Benchmark Report, nearly 1 in 6 commercial emails never reach the primary inbox globally, even when delivery rates appear healthy.
Inbox Placement vs Delivery Rate: Side-by-Side
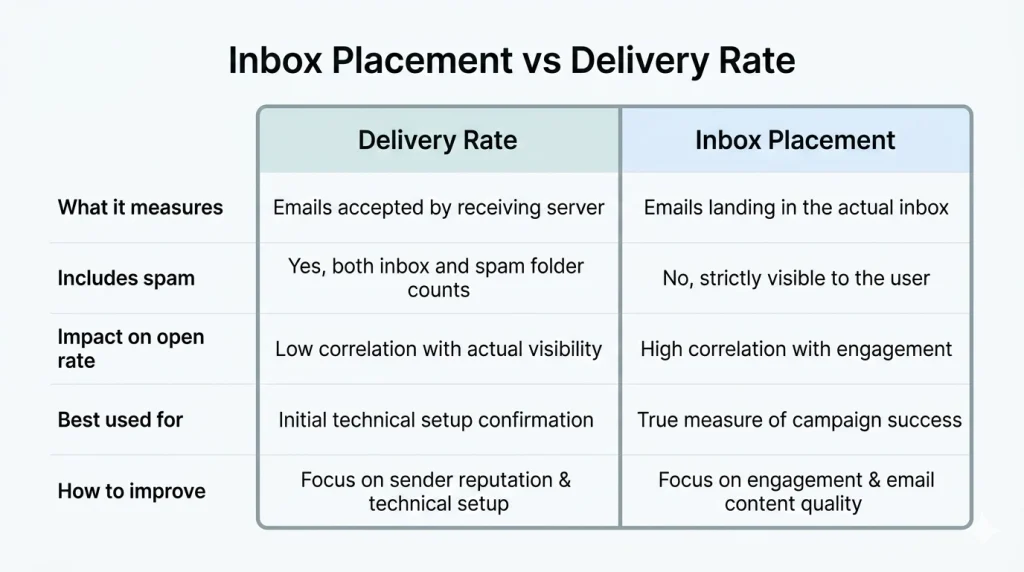
| Metric | Delivery Rate | Inbox Placement |
| What it measures | Server acceptance | Inbox visibility |
| Includes spam? | Yes | No |
| Impact on open rate | Indirect | Direct |
| Best used for | Technical monitoring | Performance optimization |
| How to improve | Fix bounce and rejection issues | Warmup, authentication, engagement |
Delivery rate indicates whether emails are leaving your system correctly. The placement metric indicates whether they are actually being seen. Both matter, but when open rate is the goal, this is the number that counts.
How Where Emails Land Directly Drives Open Rate
Open rate has one hard dependency: visibility.
If your email is not in the inbox, it cannot be opened. No subject line in the world fixes that.
When deliverability improves and more emails reach the primary tab, open rate usually follows. Not because the copy got better, but because more emails are landing in front of people who might actually read them.
This trips teams up constantly. Open rates improve after a placement fix, and the assumption is that the last subject line test must have worked. In reality, emails just started reaching more inboxes.
A 10% improvement in where your emails land can drive an 8% to 12% lift in open rate, depending on your audience and sending patterns. And the effect compounds. More opens generate stronger engagement signals, which tell providers your emails belong in the primary tab, which improves future reach.
Fix it once, and the benefit keeps building.
What Actually Affects Whether Emails Reach the Inbox?
Providers score every sender continuously, and that score drives where your emails land. None of this is random.
Authentication is the foundation.
SPF, DKIM, and DMARC need to pass cleanly. These tell inbox providers you are who you say you are. Without them, even legitimate emails get treated as suspicious from the start. Missing or misconfigured authentication is one of the fastest ways to damage your email deliverability.
Sender reputation follows.
This score reflects your entire sending history: complaint rates, bounce rates, and engagement levels. It is always being updated, and it is not forgiving. A bad stretch of sends can drag a solid reputation down fast, and rebuilding it takes time.
Domain warmup matters more than most teams think.
New domains and domains that have been inactive need to rebuild trust gradually. Sending large volumes too quickly triggers spam filters, even if your content is completely legitimate. Skipping this step is one of the most common reasons primary inbox reach drops on fresh campaigns.
Engagement history ties everything together.
Opens, replies, and clicks signal that recipients value what you are sending. Low engagement does the opposite, and over time it drags your sender reputation down further.
Content and spam trigger signals play a role too.
Certain phrases, link patterns, and formatting choices raise red flags in spam filters. Clean, relevant content that matches your audience reduces that risk and supports better deliverability over time.
All of these factors feed into how spam filters score each send. And those filters adapt constantly. They are not static rules you can outsmart once and forget.
How to Improve Inbox Placement: The Right Sequence
Most teams try to fix deliverability issues by tweaking content. That rarely works because the real problems sit at the infrastructure level.
Here is the sequence that actually moves the needle:
1. Start with authentication. Confirm that SPF, DKIM, and DMARC are properly configured and aligned across your sending domains. This is the baseline. Everything else builds on it.
2. Check your sender reputation and domain health. Look for blacklist issues, unusual complaint spikes, or reputation scores that have quietly been declining. Tools like E-Warmup surface these automatically so you are not hunting manually. You cannot fix what you have not measured.
3. Run a structured domain warmup process. Gradually increase sending volume while generating real engagement signals. This builds trust with providers over weeks, not days. Rushing this step is where most teams lose ground before a campaign even starts.
4. Run an inbox placement test. Do not assume, verify. Seed testing shows exactly where your emails are landing across providers right now. If you have not done this recently, our guide on [Inbox Placement Test: The Ignored Metric That Decides Your Open Rate in 2026] walks through the full process step by step. It is the most direct way to catch a problem before it shows up in your numbers.
5. Monitor continuously. A domain that is healthy today can develop issues after one problematic campaign. Ongoing deliverability monitoring catches problems before they damage results.
E-Warmup combines all of these steps into one platform: AI-powered domain warmup, real-time placement testing, blacklist monitoring, and sender reputation tracking. It removes the guesswork so you can focus on what to send rather than whether it will be seen.
Pre-Send Checklist
Before any campaign goes out, run through this:
- SPF, DKIM, and DMARC are all passing
- Domain and sending IP are not on any blacklists
- Warmup activity has been consistent leading up to the send
- Email content does not contain obvious spam trigger phrases
- A placement test has been completed within the past week
- Sending volume matches recent patterns, no sudden spikes
- Engagement from recent sends is within a healthy range
Catching issues before a send is significantly easier than diagnosing them after open rates drop.
How Inbox Placement, Open Rate, and Click Rate Are Connected
Click rate does not exist in isolation. It depends on everything that comes before it.
Think of it this way:
Click rate = Primary inbox reach x Open rate x Engagement after open
Each layer builds on the one before it. If fewer emails reach the primary inbox, fewer get opened. Fewer opens means fewer opportunities to click, even if the email content itself is strong.
When you fix where emails land, you lift every metric downstream. It is the highest-leverage fix available because it improves the entire funnel at once, without changing a single word of your copy.
FAQ
What is a good inbox placement rate?
Above 90% is healthy. Below 70% indicates serious email deliverability problems that will show up clearly in open and click performance.
Why is my delivery rate high but my open rate low?
High delivery rate only means emails reached the server. Many of them may still be landing in spam or promotions, where they will never be opened. Inbox placement is the metric that tells you the real story.
How do I test inbox placement?
Use seed inbox testing across providers like Gmail and Outlook. These tests show whether your emails are reaching primary, promotions, or spam before you send to your real list. Read our full breakdown in [Inbox Placement Test: The Ignored Metric That Decides Your Open Rate in 2026].
Does domain warmup actually improve inbox placement?
Yes. Domain warmup builds sender reputation by generating consistent engagement signals over time. That trust with inbox providers translates directly into better inbox placement across campaigns.
What damages sender reputation the fastest?
High complaint rates and sudden sending spikes are the biggest culprits. Poor engagement over time does sustained damage even without a single obvious trigger event.
How long does it take to improve inbox placement?
With consistent domain warmup and clean authentication, most senders see meaningful improvement within 2 to 4 weeks. Domains with existing reputation damage may take longer depending on the severity.
Conclusion
A 99% delivery rate is a comfortable number. It feels like things are working.
But the delivery rate does not tell you whether your emails are being read. Inbox placement does.
If your email open rate is not where it should be and you have already tested subject lines, send times, and copy without meaningful improvement, this is the real issue. Start by understanding where your emails are actually landing.
Run an inbox placement test. Fix authentication. Start a warmup process if your domain needs it. Then monitor consistently so the work you put in today does not quietly erode three weeks from now.
